RangeCoverage
This metric measures whether a synthetic column covers the full range of values that are present in a real column.
Data Compatibility
Numerical : This metric is meant for continuous, numerical data
Datetime : This metric converts datetime values into numerical values
This metric ignores missing values.
Score
(best) 1.0: The synthetic column covers the range of values present in the real column
(worst) 0.0: The synthetic column does not overlap at all with the range of values in the real column
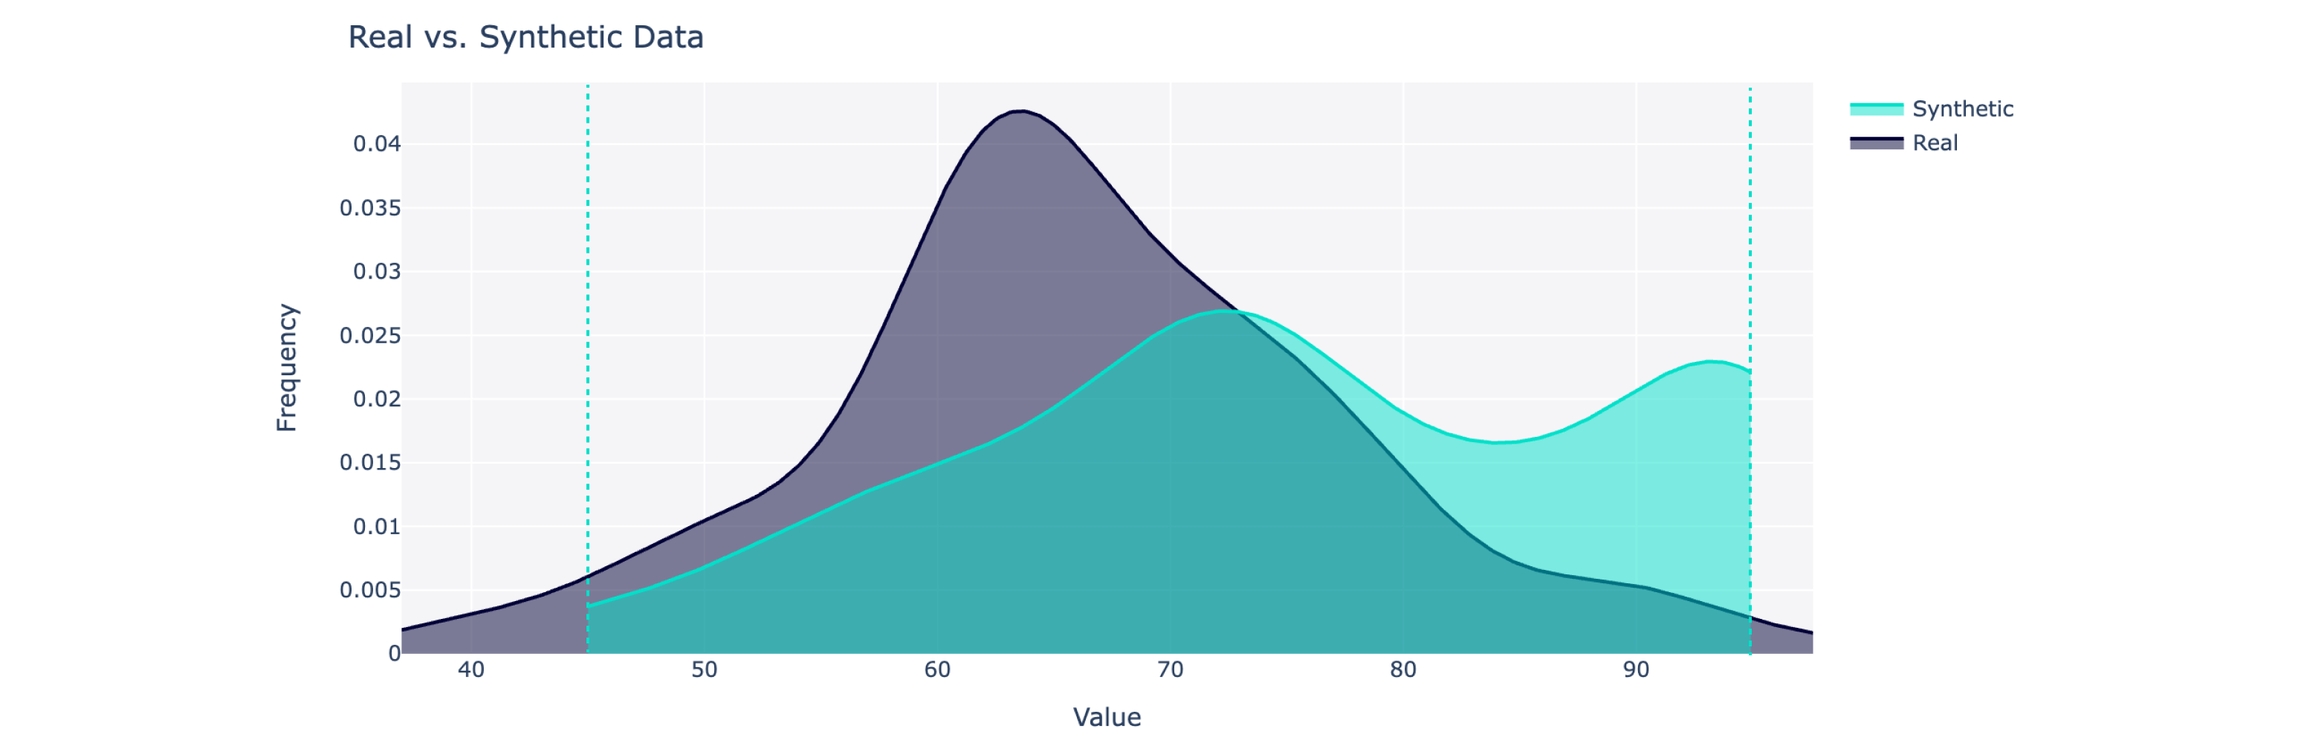
The plot below shows some fictitious real and synthetic data (black and green respectively) with RangeCoverage=0.82.
How does it work?
If r and s represent the real and synthetic columns, then this metric computes how close the min and max values of s come to the true min and max values in r according to the formula below.
If the synthetic data does has extremely poor range coverage, the equation above may become negative. In this case, we report a score 0 since it is the lowest possible value.
Note that the score isn't penalized if the synthetic data data goes out of bounds. If the synthetic data reaches beyond the real min and max, the range is fully covered and the score will be 1.
Usage
To manually apply this metric, access the single_column module and use the compute method.
Parameters
(required)
real_data: A pandas.Series object with the column of real data(required)
synthetic_data: A pandas.Series object with the column of synthetic data
FAQs
Last updated