What's included?
The quality report captures the Column Shapes, Column Pair Trends and Cardinality. This guide contains some technical details about each property.
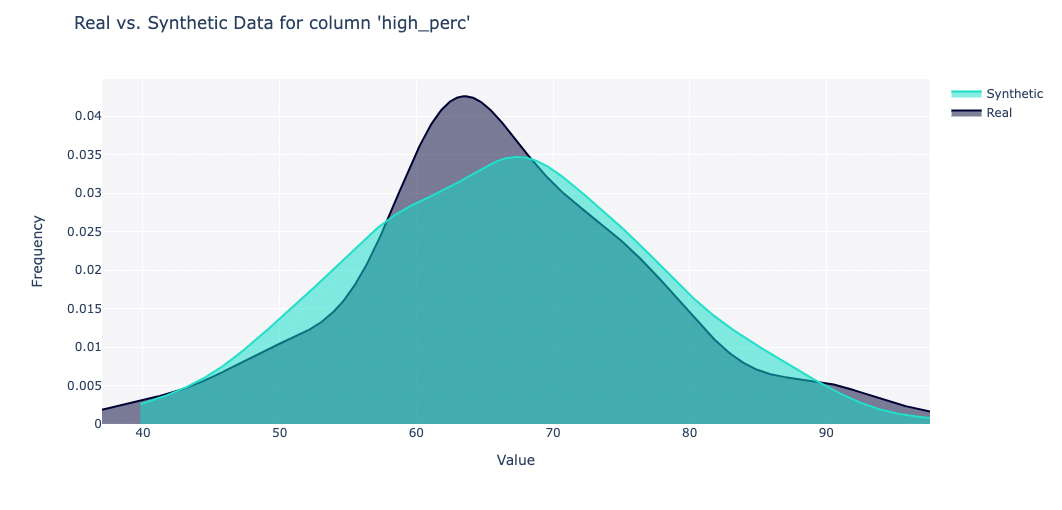
Column Shapes
Does the synthetic data capture the shape of each column?
The shape of a column describes its overall distribution. The higher the score, the more similar the distributions of real and synthetic data.
Methodology
This property applies metrics based on the column types.
| Column Type | Metric |
|---|---|
numerical | |
datetime | |
boolean | |
categorical |
This yields a separate score for every column. The final Column Shapes score is the average of all columns.
You may notice that column shape quality is better for discrete columns (categorical, boolean) as opposed to continuous columns (numerical, datetime). Generally, we've found that it's much easier to create synthetic data for a small number of known categories than large ranges of numerical values.
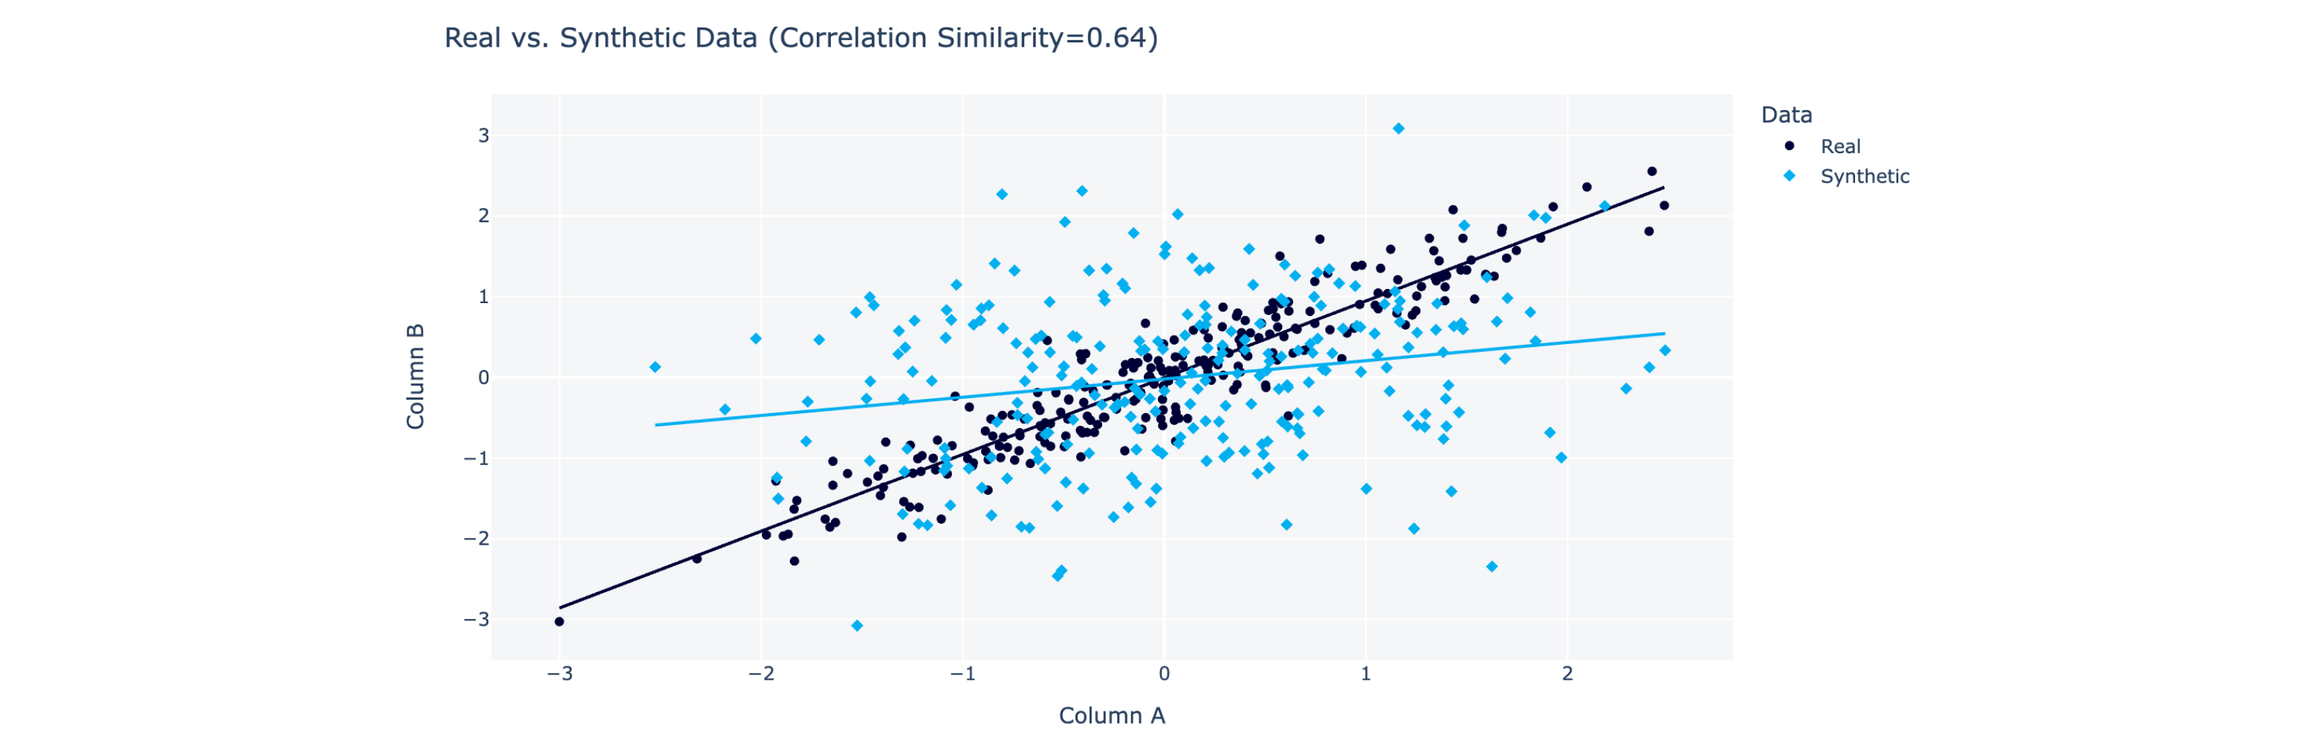
Column Pair Trends
Does the synthetic data capture trends between pairs of columns?
The trend between two columns describes how they vary in relation to each other, for example the correlation. The higher the score, the more the trends are alike.
Methodology
This property applies a different metric metric based on the type of data
| Column Types | Metric |
|---|---|
numerical (or datetime) with another numerical (or datetime) | |
categorical (or boolean) with another categorical (or boolean) | |
numerical (or datetime) with a categorical (or boolean) | Discretize the numerical columns into bins, then apply ContingencySimilarity |
This yields a score between every pair of columns. The Column Pair Trends score is the average of all the scores.
The CorrelationSimilarity metric works by computing a separate value for the real vs. the synthetic data. The Quality Report shows a side-by-side visualization for real vs. synthetic data when applicable.
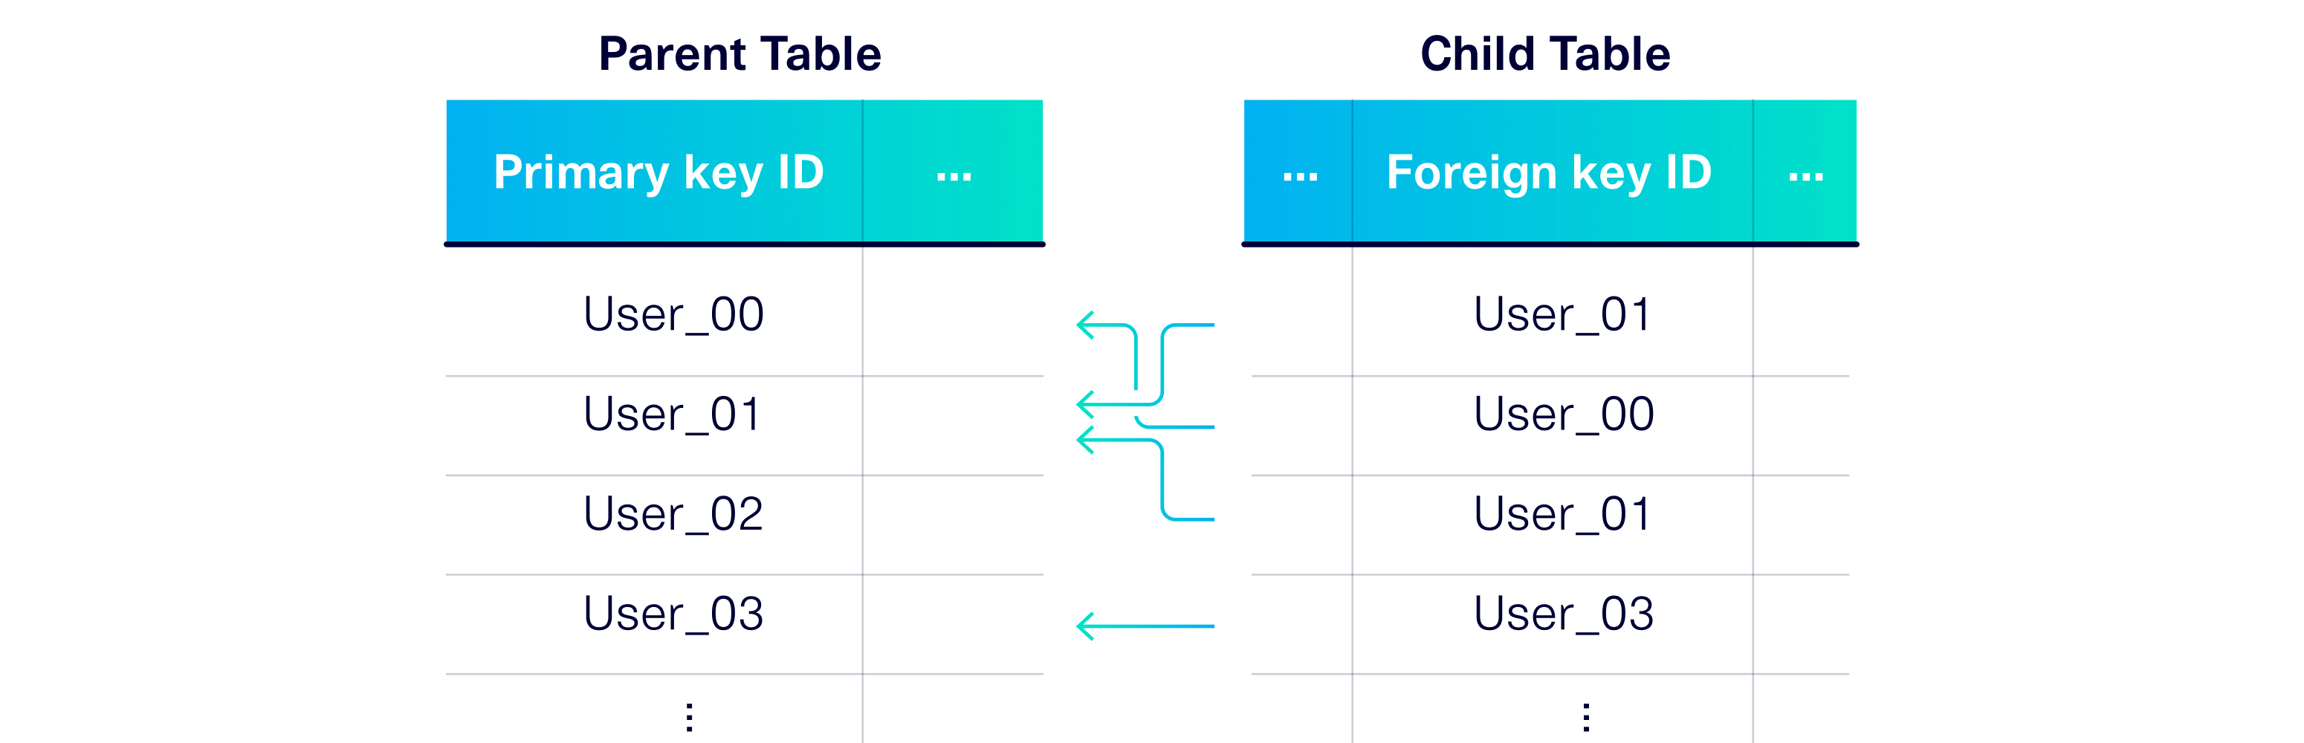
Cardinality
This property is only available for multi table datasets. (In older versions of SDMetrics, it was known as "Table Relationships".)
Does the synthetic data capture the number of connections between parent and child tables? This is also known as the cardinality of the tables.
Methodology
This property applies the CardinalityShapeSimilarity metric for every set of connected tables: parent table and child table.
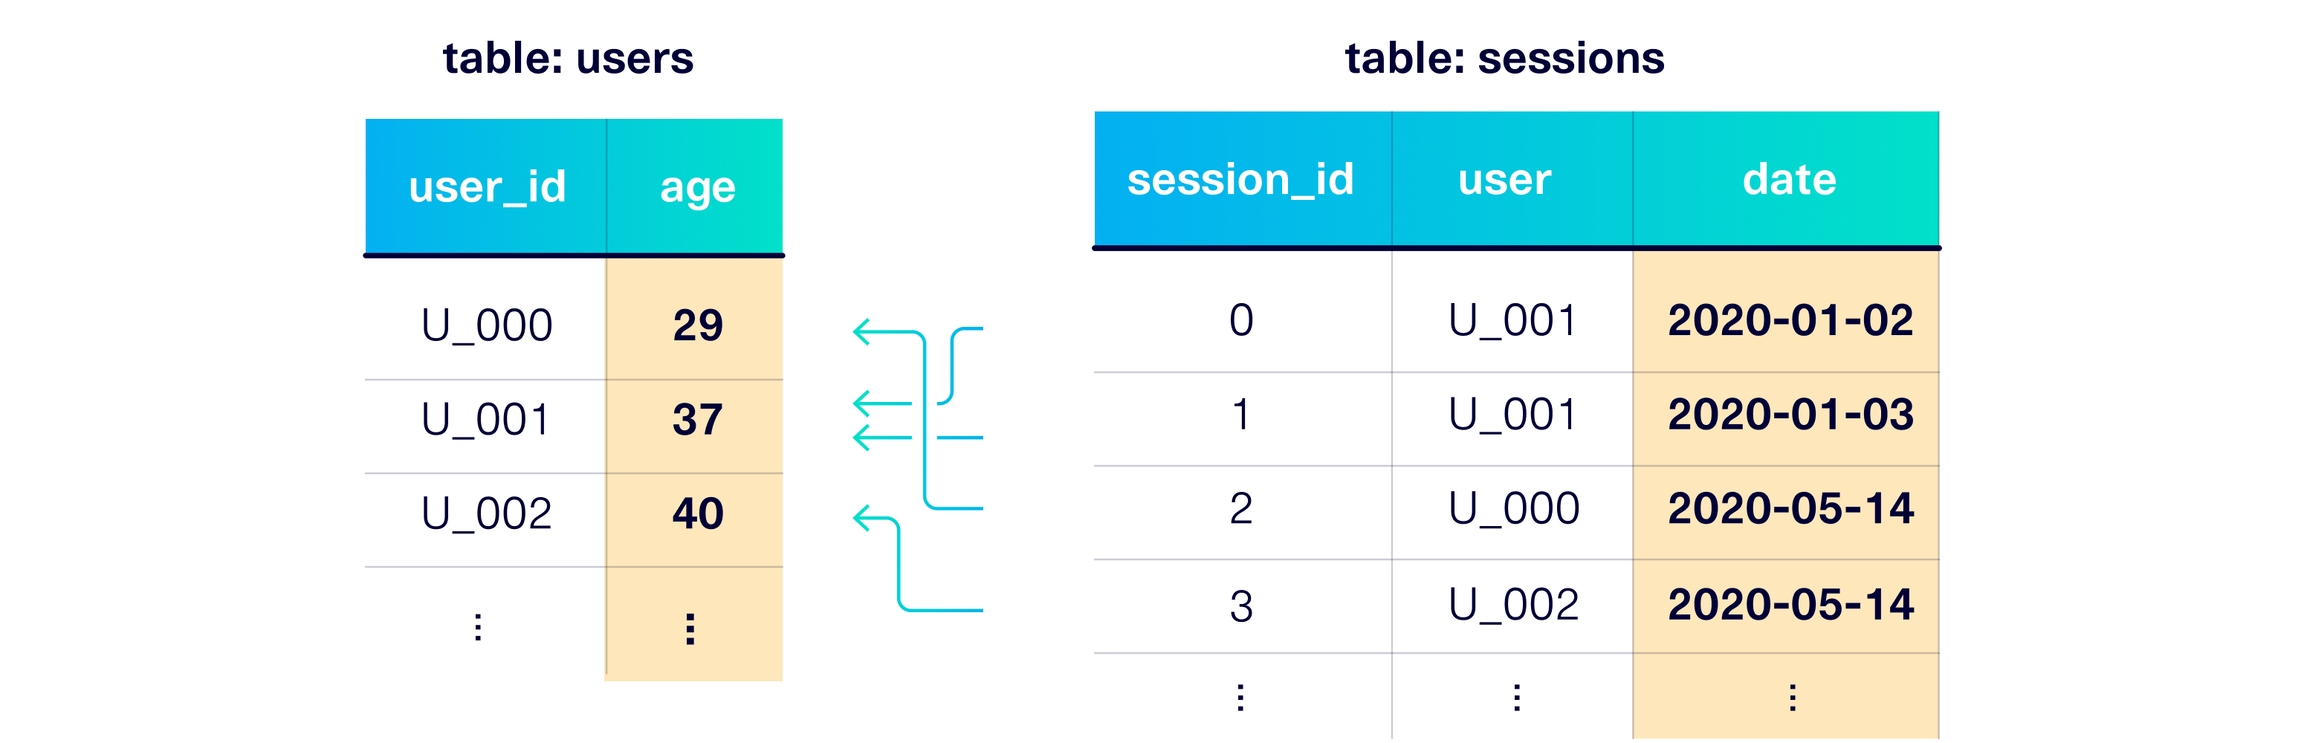
Intertable Trends
This property is only available for multi table datasets.
Does the synthetic data capture trends between columns across different tables?
This is similar to the Column Pair Trends property, but it is applied across parent/child tables. For example, a column in a parent table might be correlated with a column in the child.
Methodology
This property denormalizes the parent and child table into a single, flat table. Then, it applies the same metrics as the Column Pair Trends property.
| Column Types | Metric |
|---|---|
numerical (or datetime) with another numerical (or datetime) | |
categorical (or boolean) with another categorical (or boolean) | |
numerical (or datetime) with a categorical (or boolean) | Discretize the numerical columns into bins, then apply ContingencySimilarity |
This yields a score between every pair of columns. The Intertable Trends score is the average of all the scores.
FAQs
Last updated